Sharing the Planet
Water is essential to life, and is a limited resource for many people
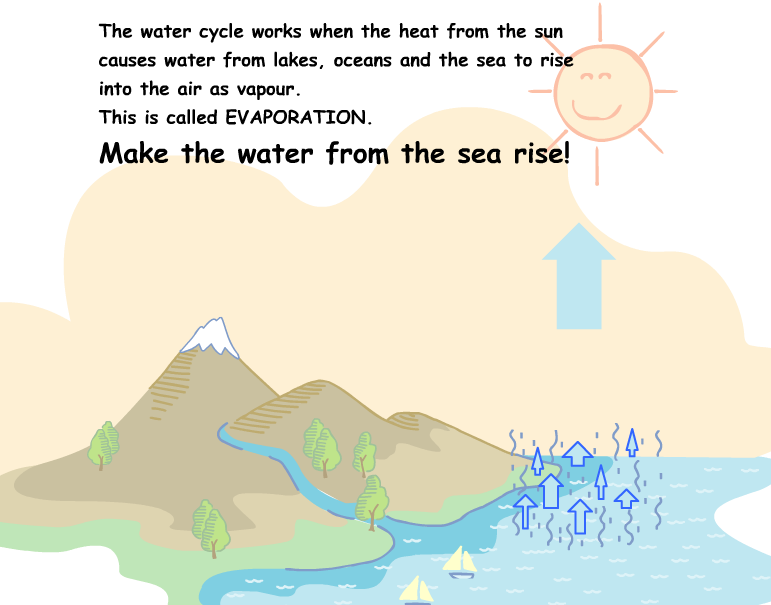
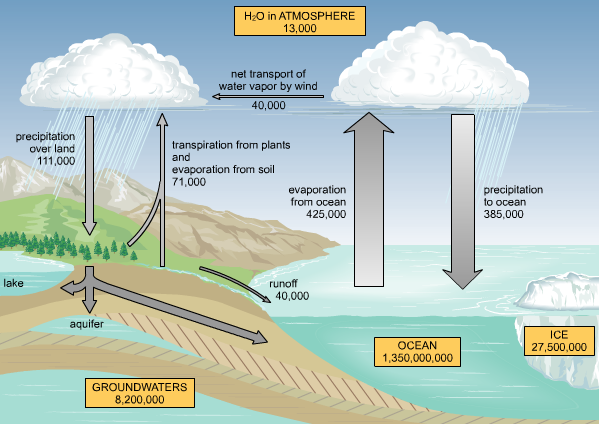
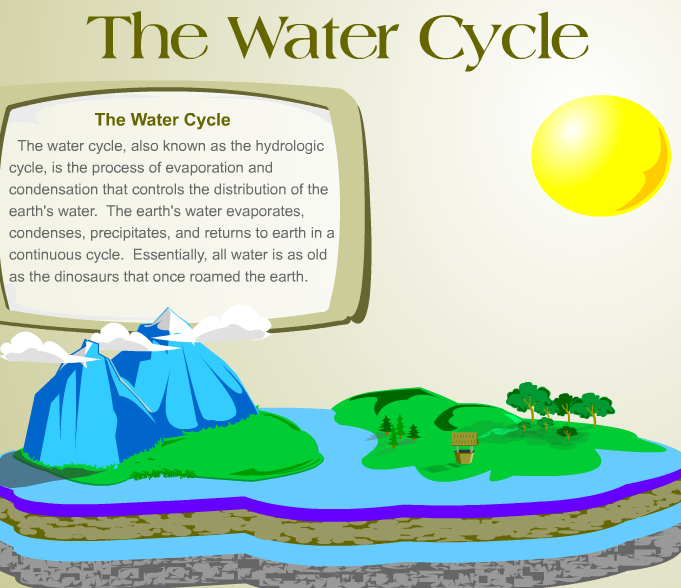
The Water Cycle - games and animations
Maker Kids - Water Pump
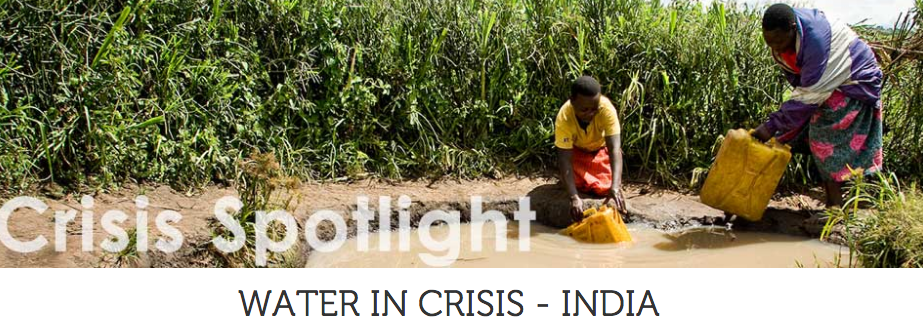
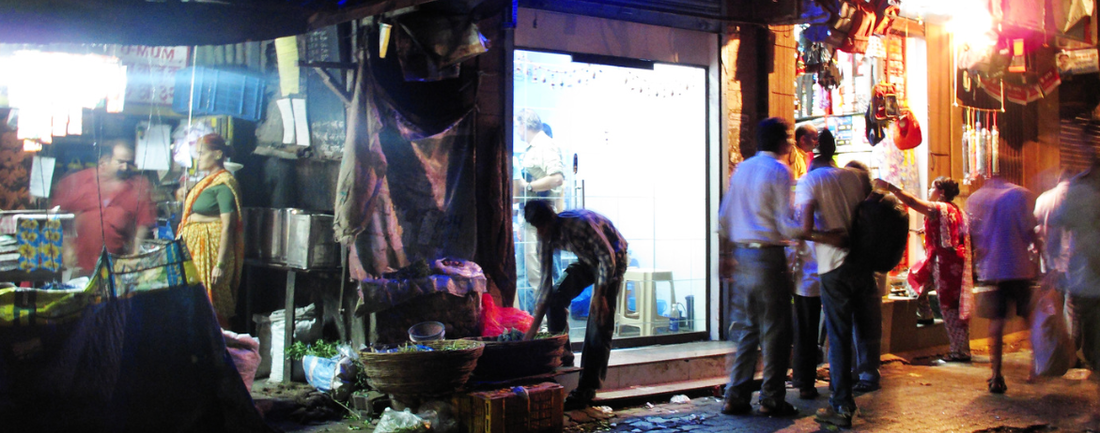
Water in India
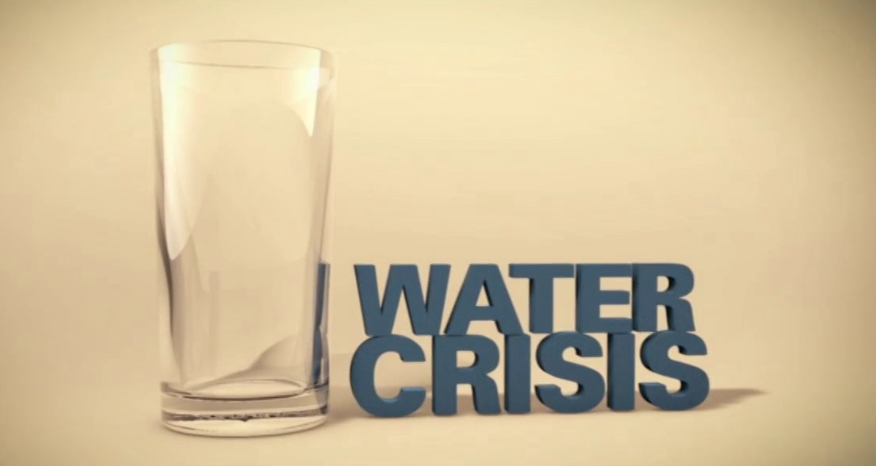
Public Service Announcements
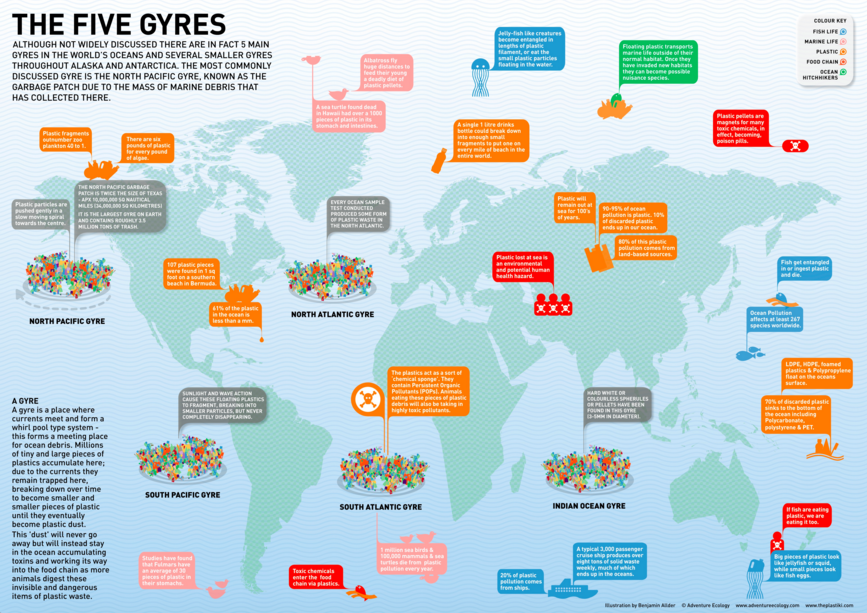
Infographics
Click on the image to make it bigger


Infographic by Seametrics, a manufacturer of water flow meter technology that measures and conserves water.

World Water Day is the title of a series of photographs from the Sacramento Bee.
Here’s another slideshow showing World Water Day events in different countries.
The UN has a special site on World Water Day with lots of resources.
Water Aid also has many resources.
The New York Times has a video on a neat simple solution for clean water.
Did you know it takes 5,500 gallons of water to produce two pounds of roasted coffee? That’s one of a number of amazing water statistics you can find on a Wall Street Journal interactive graphic they recently published.
Safe Drinking Water is a site developed by the Academy of Sciences to highlight worldwide water issues. It has several good videos that are closed-captions, along with an atlas showing which countries have less or more access to water resources. It’s definitely accessible to Intermediate English Language Learners.
Here are some games designed to help people learn how to conserve water:
Tip Tank
The Water Family Game
Mission H2O
UNICEF has a good game called Water Alert! about water issues in the developing world. It provides audio support for the text.
GOOD Magazine has an infographic called Walk This Way: Making The Right Choices To Reduce Your Water Imprint.
The British newspaper The Guardian has several online videos related to World Water Day.
The Green IQ Game has several different modules, including one on water.
The CBBC Newsround has a very accessible Guide To Water.
The BBC has two useful interactives — one is a map of “water hotspots” and the other is a“Fact File.”
Here’s a Red Cross slideshow on water issues.
Water Conservation Around The House is an interactive sharing ways to conserve water.
Decide who gets water in California by playing this game.
Ten Things You Should Know About Water is a good infographic.
The Bonneville Environmental Foundation has very engaging carbon and water calculators to determine your environmental impact. In addition, their suggestions for how to reduce them are equally well-done.
Find Water Polluters Near You is an interactive from The New York Times. You can type in your zip code and then learn about nearby companies cited for polluting local water.
The Times also has a video called Toxic Waters.
The Coming Water Wars is a great infographic.
World Water Day 2010 is a series of photos from MSNBC.
World Water Day is from The Boston Globe’s Big Picture.
Safe Water For All is a CNN video.
What’s Your Water IQ? is an interactive quiz.
From Lettuce to Beef, What’s the Water Footprint of Your Food?
World’s Water Content is an intriguing infographic.
There are several interactives to help you determine how much water you use:
What is your Water Footprint?
One Minute Water Calculator
Water Footprint: Quick Calculator
Water Footprint: Extended Calculator
Water Footprint Calculator comes from National Geographic
National Geographic has several water-related features:
How Much Water Is Embedded In Everyday Life is an interactive.
Water: A Special Issue
Freshwater
Water Is Life — Photography
Save Your Water is a neat interactive from Underwriters Laboratories. It’s designed to help you identify your water usage and ways to reduce it, and lets people make a pledge on what they will do. For each of the first 15,000 pledges received, UL will donate one dollar toWater for People.
Water Economics is the title of a neat infographic on water use around the world.
GOOD Magazine has several resources:
An infographic showing water conflicts around the world.
These next two are a little different, but I thought readers might still find them useful:
Absence of Water is an interesting slideshow.
Crowdsourced Picture Show About Water is another slideshow.
“Pakistan Water Crisis” is a series of photos from The Sacramento Bee.
“Stop Drinking Bottled Water” is a fairly accessible infographic on the environmental consequences of using bottled water. I’m pretty confident that the information is accurate, but I wish they had toned down the rhetoric a bit.
“Glass Half Empty: The Coming Water Wars” is an infographic reviewing the water crisis in different parts of the world.
Water and Cities: Facts and Figures is a useful interactive.
World Water Day 2011 comes from The Sacramento Bee.
There was a contest connected to the Day to develop the best water-related infographics. You can see all of the submitted infographics — and there are a lot of them — here.
Fresh Water Supply is an interactive that lets you explore water usage around the world.
Tapped Out: The World Water Crisis has a number of lesson plans.
